Climate for Richmond, Virginia
Home : Climate Graphs: Virginia : Richmond
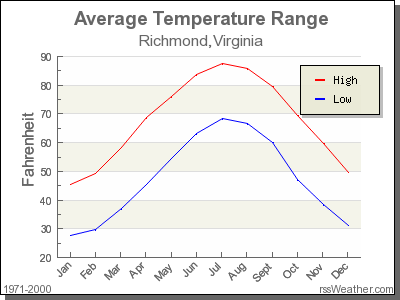
Average Temperatures for Richmond
| Month | Low | High |
|---|---|---|
| Jan | 27.6°F | 45.3°F |
| Feb | 29.7°F | 49.3°F |
| Mar | 37.0°F | 58.4°F |
| Apr | 45.3°F | 68.9°F |
| May | 54.6°F | 76.2°F |
| Jun | 63.3°F | 83.6°F |
| Jul | 68.3°F | 87.5°F |
| Aug | 66.8°F | 85.7°F |
| Sept | 59.9°F | 79.7°F |
| Oct | 47.2°F | 69.3°F |
| Nov | 38.4°F | 59.7°F |
| Dec | 31.1°F | 49.7°F |
Richmond's coldest month is January when the average temperature overnight is 27.6°F. In July, the warmest month, the average day time temperature rises to 87.5°F.
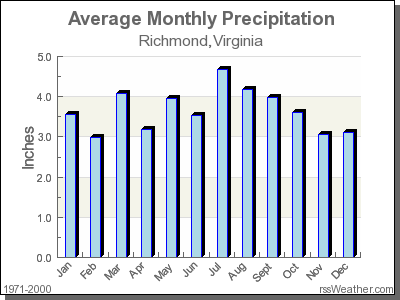
Average Rainfall for Richmond
| Month | Precipitation |
|---|---|
| Jan | 3.55in. |
| Feb | 2.98in. |
| Mar | 4.09in. |
| Apr | 3.18in. |
| May | 3.95in. |
| Jun | 3.54in. |
| Jul | 4.67in. |
| Aug | 4.18in. |
| Sept | 3.98in. |
| Oct | 3.60in. |
| Nov | 3.06in. |
| Dec | 3.12in. |
The driest month in Richmond is February with 2.98 inches of precipitation, and with 4.67 inches July is the wettest month.