Climate for Lynchburg, Virginia
Home : Climate Graphs: Virginia : Lynchburg
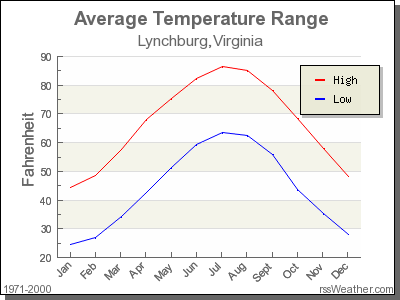
Average Temperatures for Lynchburg
| Month | Low | High |
|---|---|---|
| Jan | 24.5°F | 44.5°F |
| Feb | 26.9°F | 48.6°F |
| Mar | 34.4°F | 57.6°F |
| Apr | 42.6°F | 68.0°F |
| May | 51.2°F | 75.5°F |
| Jun | 59.5°F | 82.5°F |
| Jul | 63.7°F | 86.4°F |
| Aug | 62.4°F | 85.1°F |
| Sept | 55.9°F | 78.3°F |
| Oct | 43.7°F | 68.4°F |
| Nov | 35.2°F | 58.0°F |
| Dec | 27.9°F | 48.4°F |
Lynchburg's coldest month is January when the average temperature overnight is 24.5°F. In July, the warmest month, the average day time temperature rises to 86.4°F.
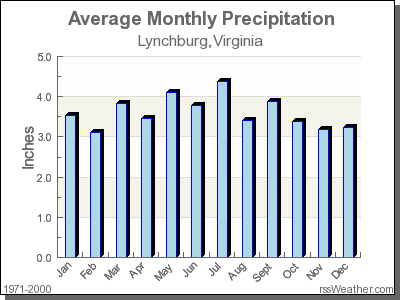
Average Rainfall for Lynchburg
| Month | Precipitation |
|---|---|
| Jan | 3.54in. |
| Feb | 3.10in. |
| Mar | 3.83in. |
| Apr | 3.46in. |
| May | 4.11in. |
| Jun | 3.79in. |
| Jul | 4.39in. |
| Aug | 3.41in. |
| Sept | 3.88in. |
| Oct | 3.39in. |
| Nov | 3.18in. |
| Dec | 3.23in. |
The driest month in Lynchburg is February with 3.10 inches of precipitation, and with 4.39 inches July is the wettest month.