Climate for Burlington, Vermont
Home : Climate Graphs: Vermont : Burlington
Average Temperatures for Burlington
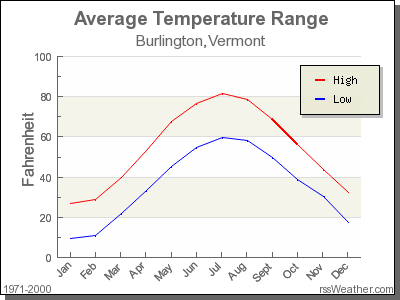
| Month | Low | High |
|---|---|---|
| Jan | 9.3°F | 26.7°F |
| Feb | 10.9°F | 29.0°F |
| Mar | 21.8°F | 39.6°F |
| Apr | 33.6°F | 53.3°F |
| May | 45.2°F | 67.8°F |
| Jun | 54.7°F | 76.5°F |
| Jul | 59.8°F | 81.4°F |
| Aug | 58.1°F | 78.4°F |
| Sept | 49.9°F | 68.9°F |
| Oct | 38.9°F | 56.4°F |
| Nov | 30.3°F | 44.0°F |
| Dec | 17.3°F | 32.3°F |
Burlington's coldest month is January when the average temperature overnight is 9.3°F. In July, the warmest month, the average day time temperature rises to 81.4°F.
Average Rainfall for Burlington
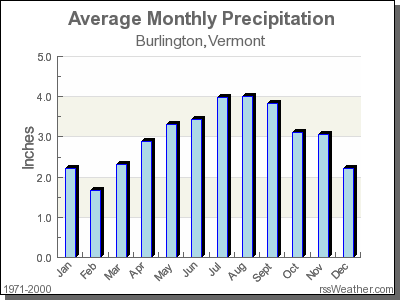
| Month | Precipitation |
|---|---|
| Jan | 2.22in. |
| Feb | 1.67in. |
| Mar | 2.32in. |
| Apr | 2.88in. |
| May | 3.32in. |
| Jun | 3.43in. |
| Jul | 3.97in. |
| Aug | 4.01in. |
| Sept | 3.83in. |
| Oct | 3.12in. |
| Nov | 3.06in. |
| Dec | 2.22in. |
The driest month in Burlington is February with 1.67 inches of precipitation, and with 4.01 inches August is the wettest month.