Climate for Roswell, New Mexico
Home : Climate Graphs: New Mexico : Roswell
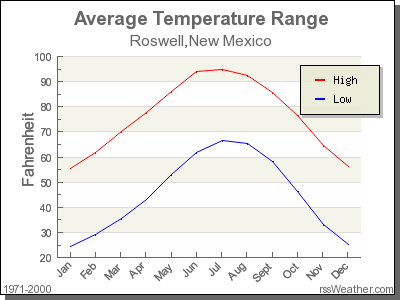
Average Temperatures for Roswell
| Month | Low | High |
|---|---|---|
| Jan | 24.4°F | 55.6°F |
| Feb | 29.3°F | 62.0°F |
| Mar | 35.7°F | 70.0°F |
| Apr | 43.3°F | 77.7°F |
| May | 53.2°F | 86.0°F |
| Jun | 62.0°F | 94.0°F |
| Jul | 66.7°F | 94.8°F |
| Aug | 65.5°F | 92.3°F |
| Sept | 58.3°F | 85.7°F |
| Oct | 46.3°F | 76.5°F |
| Nov | 33.3°F | 64.5°F |
| Dec | 25.1°F | 56.3°F |
Roswell's coldest month is January when the average temperature overnight is 24.4°F. In July, the warmest month, the average day time temperature rises to 94.8°F.
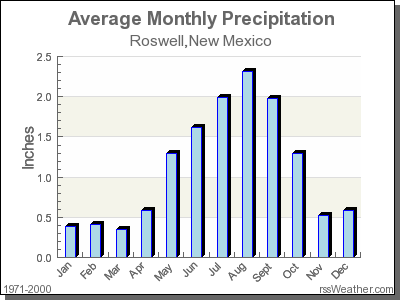
Average Rainfall for Roswell
| Month | Precipitation |
|---|---|
| Jan | 0.39in. |
| Feb | 0.41in. |
| Mar | 0.35in. |
| Apr | 0.58in. |
| May | 1.30in. |
| Jun | 1.62in. |
| Jul | 1.99in. |
| Aug | 2.31in. |
| Sept | 1.98in. |
| Oct | 1.29in. |
| Nov | 0.53in. |
| Dec | 0.59in. |
The driest month in Roswell is March with 0.35 inches of precipitation, and with 2.31 inches August is the wettest month.