Climate for Tulsa, Oklahoma
Home : Climate Graphs: Oklahoma : Tulsa
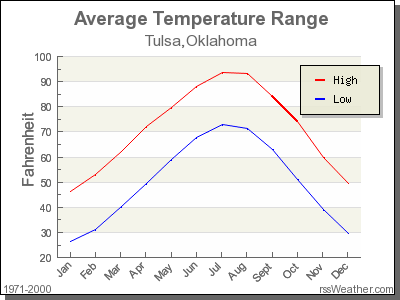
Average Temperatures for Tulsa
| Month | Low | High |
|---|---|---|
| Jan | 26.3°F | 46.5°F |
| Feb | 31.1°F | 52.9°F |
| Mar | 40.3°F | 62.4°F |
| Apr | 49.5°F | 72.1°F |
| May | 59.0°F | 79.6°F |
| Jun | 67.9°F | 88.0°F |
| Jul | 73.1°F | 93.8°F |
| Aug | 71.2°F | 93.2°F |
| Sept | 62.9°F | 84.1°F |
| Oct | 51.1°F | 74.0°F |
| Nov | 39.3°F | 60.0°F |
| Dec | 29.8°F | 49.6°F |
Tulsa's coldest month is January when the average temperature overnight is 26.3°F. In July, the warmest month, the average day time temperature rises to 93.8°F.
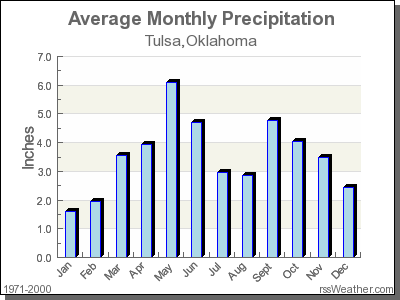
Average Rainfall for Tulsa
| Month | Precipitation |
|---|---|
| Jan | 1.60in. |
| Feb | 1.95in. |
| Mar | 3.57in. |
| Apr | 3.95in. |
| May | 6.11in. |
| Jun | 4.72in. |
| Jul | 2.96in. |
| Aug | 2.85in. |
| Sept | 4.76in. |
| Oct | 4.05in. |
| Nov | 3.47in. |
| Dec | 2.43in. |
The driest month in Tulsa is January with 1.60 inches of precipitation, and with 6.11 inches May is the wettest month.